Project Background

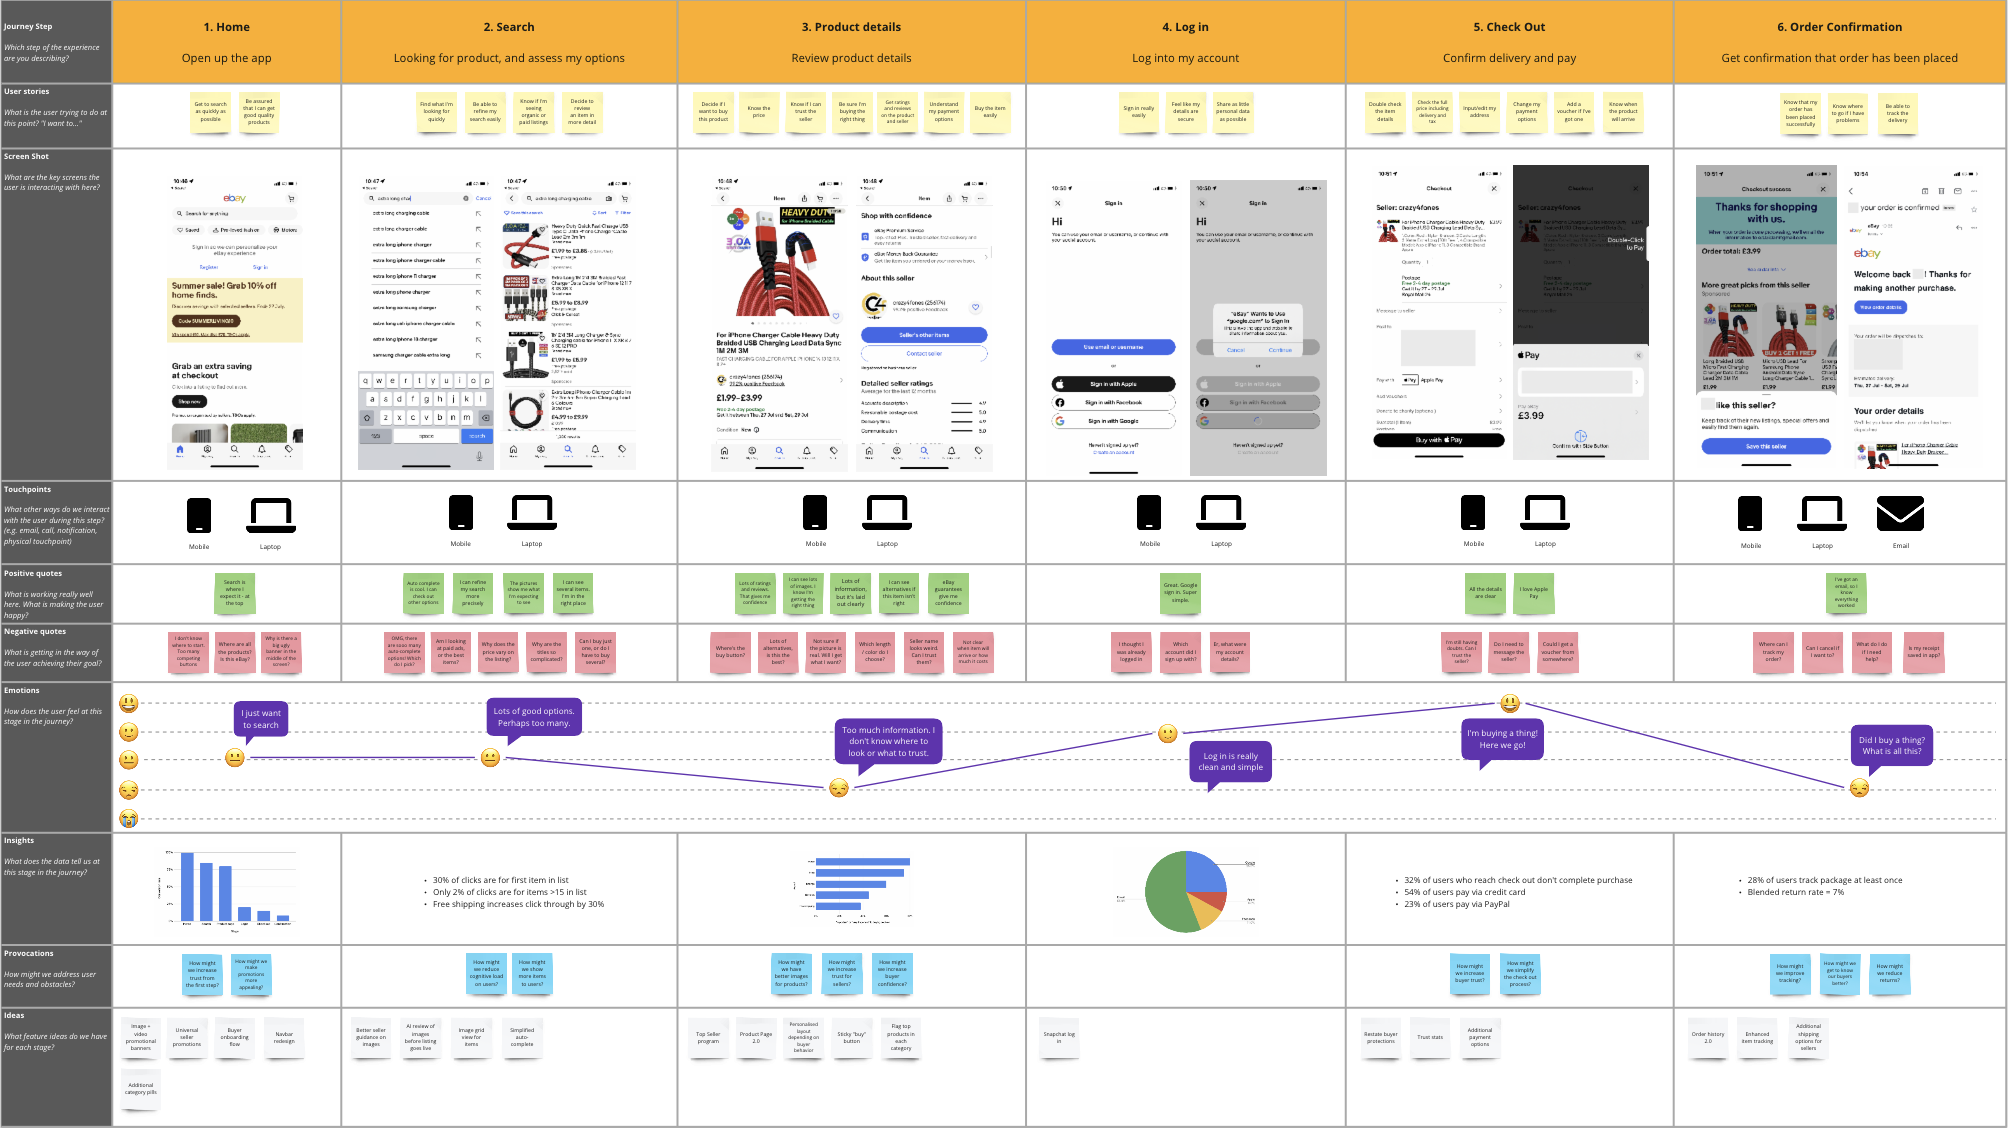
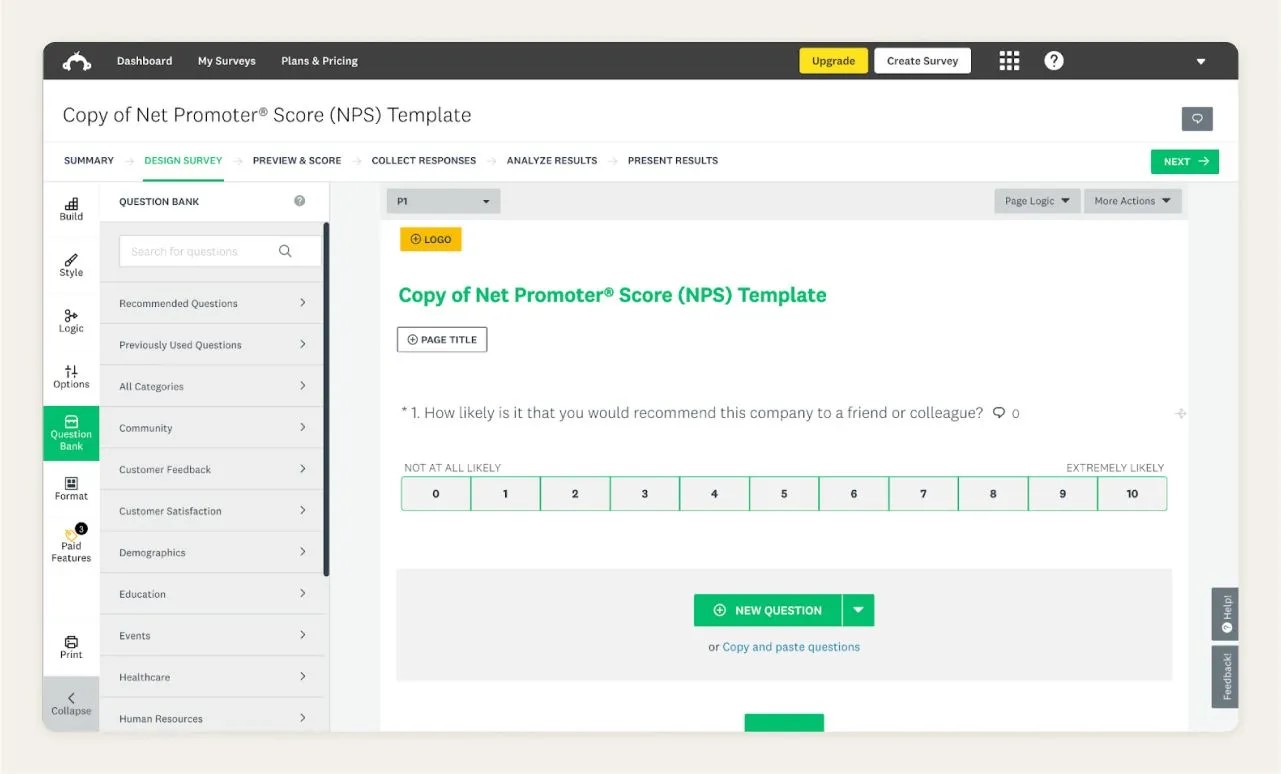
Universal Robots lacked a standardized way to measure and track customer experience. Without clear benchmarking, identifying friction points was difficult. I led a data-driven research initiative, designing a survey with 120+ questions, and leveraged Power BI and statistical analysis to provide insights that helped refine customer experience strategies.

The research involved:

  • Designing a survey with over 120 targeted questions for more than 30,000 customers.
  • Collaborating with cross-functional stakeholders to refine survey content.
  • Recruiting participants and managing incentives for more than 1000 respondents.
  • Cleaning, analyzing, and visualizing the data for key insights.

Note: Due to NDA restrictions, this case study focuses on the research process rather than specific results.

Team

Conducted UX research in collaboration with an Insight Lead (project lead) and Head of UX.

Duration

12 Weeks (2 iterations)

Tools

SurveyMonkey, Power BI, Excel, Miro

Skills

Survey Design, Data Analysis, Stakeholder Engagement

Challenge

  • Customer experience data was scattered across different teams, making it difficult to track trends and prioritze produc decisions.
  • No standardized metrics to benchmark user satisfaction and friction points.

Solution

  • Developed a reporting framework that influenced product and customer success strategies, enabling Universal Robots to prioritize key pain points in their roadmap.
  • Customer satisfaction and willingness to buy all improved within one year, with 80% of tracked metrics showing measurable gains.
  • Designed an insights-sharing Power BI dashboard that made customer experience data more accessible to leadership and product teams.
  • Established quarterly pulse NPS scores, enabling continuous tracking of customer satisfaction and identifying trends over time.

Process Overview

1
Identifying Research Priorities
2
Conducting Research
3
Data Cleaning & Analysis
4
Reporting
5
Reflections & Impact
Survey Design Process

We used Miro for survey structure and stakeholder feedback (Not the actual board)

Phase 1 - Identifying Research Priorities

Tools Used: Miro, SurveyMonkey.

  • Conducted stakeholder interviews to align research objectives across teams.
  • Mapped stakeholder priorities to ensure business and user needs were addressed.
  • Identified key pain points in the customer journey through existing qualitative insights.
Data Cleaning Process

I used SurveyMonkey for building the survey structure (Not the actual survey)

Phase 2 - Build and Launch

Tools Used: Miro, SurveyMonkey.

  • Designed and structured a 120+ question survey to align business objectives with user needs.
  • Applied logic-based branching to personalize the survey experience and improve relevance.
  • Implemented validation techniques to ensure data accuracy and prevent inconsistent responses.
  • Optimized the survey flow to reduce survey fatigue while maintaining useful data.

Phase 3 - Data Cleaning & Analysis

Tools Used: SurveyMonkey, Excel, Power BI, Python (limited).

  • Set up incentives and launched the survey via SurveyMonkey to a global audience of over 30,000 users, collecting 1000+ complete responses in multiple languages.
  • Used Power Query in Power BI to clean and transform survey data, ensuring consistency across responses.
  • Clustered 3,000 qualitative comments in EnjoyHQ to identify key friction points.
  • Applied error bars and statistical analysis by using DAX formulas in Power BI to validate data reliability and detect trends.
  • Built dynamic Power BI dashboards with demographic filters and slice and dice functionality

Phase 4 - Reporting and Visualization

Tools Used: PowerPoint, Power BI

  • Delivered a comprehensive report and interactive Power BI dashboards, ensuring stakeholders could explore insights tailored to their needs.
  • Provided data-driven recommendations to improve customer experience and business decisions.
  • Facilitated discussions to align insights with strategic decision-making and product roadmaps.
  • Integrated research insights into ongoing projects and long-term planning for continuous improvements.

Phase 5 - Reflections & Impact

Reflections

  • Prioritization is essential: I learned to focus on the most actionable insights, ensuring clarity for stakeholders.
  • Plan for extra time: Large-scale surveys often require unexpected adjustments, so I now build buffer time into every project.
  • Consistency in benchmarking: Selecting the right variables ensures long-term comparability, helping track progress year over year.

Impact

  • Product prioritizations based on the results led to an 80% improvement in key metrics the following year.
  • Standardized customer experience metrics to ensure consistent benchmarking.
  • Delivered actionable insights that identified key friction points.
  • Enabled tracking of measurable improvements across user touchpoints.
  • Informed strategic decisions in product development and customer success.